As developers, investors and plant operators explore options to increase production and market share of renewable fuels, the concept of carbon intensity (CI) must be well-understood. It might be the deciding factor that determines economic viability of your biofuels project.
In California and an increasing number of other states, CI is the metric that will directly impact investment returns for renewable fuels production facilities. California’s Low Carbon Fuel Standard (LCFS) uses CI as a tool to measure the estimated life-cycle carbon emissions of a given fuel, relative to the energy it produces during combustion. This measurement is based on the Argonne National Laboratory Greenhouse Gases, Regulated Emissions, and Energy Use in Transportation (GREET model).
Understanding the CI of a renewable fuel is important because it is directly proportional to the monetary incentive provided by the LCFS program. Failure to accurately analyze and understand the CI methodology can unfortunately result in millions of dollars in lost revenue.
Renewable Fuels Standard
California’s LCFS program dovetails with the federal Renewable Fuel Standard (RFS) program, which also incentivizes fuels that are less carbon intensive.
Administered by the EPA, the RFS program establishes incentives by assigning Renewable Identification Numbers (RINs) as a basis for assigning values for the relative impact of carbon reduction. Different fuel types are categorized under a “D-code” system that identifies the renewable fuel type based on the feedstock used, fuel type produced, energy inputs and greenhouse gas (GHG) reduction thresholds met, along with other requirements.
Under the federal program, for example, cellulosic ethanol producers receive a D3 RIN. This fuel type has a higher impact on greenhouse gas reduction as compared to biodiesel, which receives a D4 RIN and holds a lower monetary value. Further, biodiesel has a higher impact on greenhouse gas reduction compared to corn ethanol, which receives a D6 RIN that has even less monetary value in the RFS program.
Different Pathways
Not all biofuels are created equal. The most sustainable fuels are those that produce the lowest CI. Put simply: The lower the CI of a given biofuel below the LCFS target for the year, the higher the market value and potential for investment returns.
We can broadly divide biofuels into three categories:
- First generation
- Current generation
- Advanced biofuels
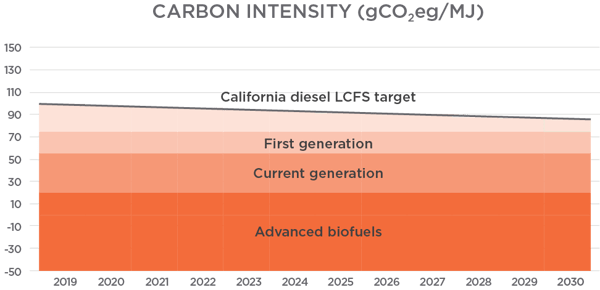
Figure 1: The market value of three categories of renewable fuels is based on a carbon intensity scale (the vertical axis).
Because advanced biofuels have lower CI, they are assigned more value in the RINS and LCFS programs compared to first generation and current generation biofuels. However, advanced biofuels tend to be produced in smaller volumes and carry more technical and commercial risk.
First Generation Biofuels
First generation biofuels such as corn ethanol and soybean-based biodiesel have a relatively high CI ranking in the California LCFS program due to factors such as indirect land use change (ILUC). The purpose of ILUC is to discourage forest clearing and other environmentally destructive activities for the production of biofuels. Both corn ethanol and soybean-based biodiesel have approximately 30 gCO2/MJ added to the CI score of their pathways.
While not directly penalized for ILUC in the RFS program, corn ethanol and soybean-based biodiesel receive less incentive compared to other fuels such as cellulosic ethanol that are unlikely to lead to deforestation.
While still quite valuable in California and incentivized by the federal RFS program, these fuels are less attractive than other pathways. As the California LCFS program approaches 2030, these first-generation biofuels will become even less valuable as the annual target decreases.
Current Generation (Lower CI) Biofuels
Current generation biofuels are considerably more attractive in the LCFS market. These fuels include fatty acid methyl ester (FAME) biodiesel and renewable diesel that obtain their feedstock from animal fats, used cooking oil and other low carbon intensity pathway feedstocks. These feedstocks are not penalized by ILUC and therefore have a more attractive CI. While the facilities to convert this material to diesel tend to be more capital-intensive to construct, the ROI associated with lower CI fuels often justifies the incremental investment.
Advanced (Very Low CI) Biofuels
These so-called advanced biofuels include processes such as cellulosic biomass-to-ethanol, cellulosic biomass-to-diesel, jet fuel, and gasoline. Feedstocks may include wheat straw, corn stover, dairy manure or municipal solid waste and result in CI scores that are near zero or negative. These are high-reward products. Producing them, however, comes with more risk and requires more capital investment than today’s biofuels. Further, these fuels are generally produced in small volumes at demonstration or small commercial plants.
The table below identifies some first generation, current generation and advanced biofuels, as described above.
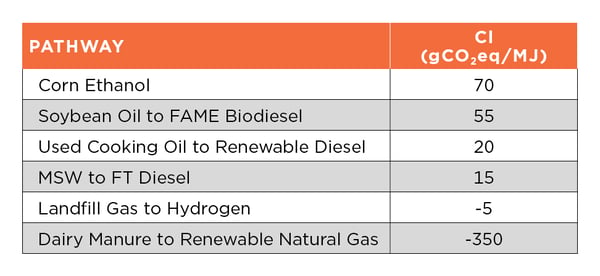
Figure 2: The approximate CI values of some first generation, current generation and next generation biofuels. Note the extremely low CI value for dairy manure to renewable natural gas (RNG). This is because it assumes the methane gas from the manure would otherwise be released into atmosphere, producing a large CO2-equivalent impact on global warming.
Adjusting Your Process to Reduce CI
Though feedstocks limit the relative ranges of CI reduction, there are options to significantly adjust your process to minimize the CI penalty while capturing attractive incremental returns on investment.
For example, the CI score for the corn ethanol process and renewable diesel process can be lowered via carbon capture. With federal incentives in Code §45Q for carbon capture in the range of $35-$50 per ton, U.S. biofuel producers can also “double dip” on incentives. Separately, providing electricity from a solar, wind or other low-CI source is a choice that many renewable fuel producers are considering for current or future plants.
Technology selection is another factor that matters when developing a sustainable renewable fuel plant that achieves a low CI score. Since there are often multiple pathways to produce the same biofuel, there are opportunities to make that biofuel with less carbon intensity.
More Than California
While West Coast (California and Oregon) policy is largely driving investment in the United States, it is important to note that there are incentives already available for biofuel plants in Brazil, Europe and some Canadian provinces, where LCFS policies continue to emerge and evolve. Other programs are likely to be put in place soon in Washington state as well as several northeastern U.S. states.
Europe is one of the more mature markets for renewable fuels, and the Nordic countries are widely acknowledged as one of the more attractive markets. However, it is important to be aware that some markets reward CI differently than California does. All these nuances and variables must be well-understood when building a business case for a new facility.
The most successful biofuels producers will carefully select their plant location and target markets considering feedstock availability, target markets and future legislation.
Quantifying the Risks
Producing fuels from biological feedstocks is a decarbonization pathway that is clearly building momentum. The interest from oil companies that has developed in the past few years has certainly confirmed that the impacts will be relevant in the next decade with several programs supporting the investment as described herein.
Developers and investors can earn attractive returns on a number of renewable fuels investment choices, but they are contingent upon a good understanding of the opportunities and risks. There are a number of variables that can affect CI, and these can differ among U.S. states, not to mention other countries.
Before committing substantial capital investment, these technical and economic risks can and should be quantified. With proper due diligence and upfront analysis, clear choices will emerge for sustainable feedstocks and technology pathways.
See how CI, among other factors, plays a role in renewable diesel.