The Renewable Fuel Standard (RFS) program was created by the Energy Policy Act (EPA) of 2005 and expanded by the Energy Independence Act of 2007. The intention of the program was to reduce dependence on foreign oil imports by incentivizing the growth of ethanol and biodiesel industries. Arguably, it has been successful in contributing toward this goal but has fallen short of program objectives.
Renewable Identification Numbers (RINs) were created under the RFS program for the oil industry to comply with the blending requirements. A RIN is an identification number assigned to a batch of biofuel to track its production, trade-offs, transfers and final use.
By 2022, the RFS program will be encouraging and incentivizing others to blend 36 billion gallons of renewable fuel per year as highlighted in Figure 1. As of 2020, 20 billion gallons of renewable fuel has been blended, with a contribution of less than 0.5 billion gallons of low-carbon-intensity D-3 RIN fuels. This gap is largely due to cellulosic ethanol technology challenges that the biofuels industry continues to address.
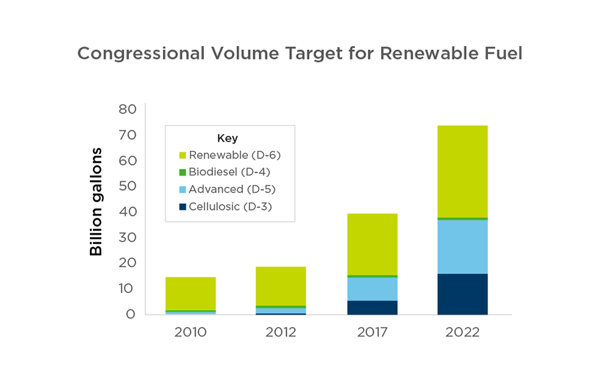 Figure 1: Renewable fuel standard goals. Source: EPA
While recognizing its shortfalls, RFS has helped achieve:
- 1,120,000 barrels per day (bpd) of corn ethanol capacity
- 170,000 bpd of biodiesel and renewable diesel capacity
- Elimination of over 60 million tons per year of CO2, or 2.5% reduction in transportation emissions
Despite these achievements, the RFS is not widely recognized as a carbon reduction program. Perhaps this is due to the structure of the RFS program. RINs are not a carbon tax but instead part of a program that passes capital from oil refiners to blenders to biofuel producers without being collected by a government entity.
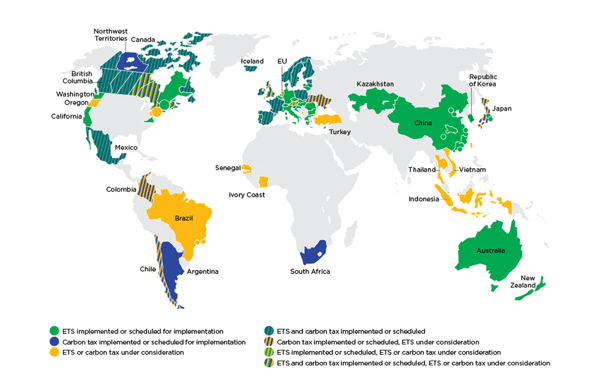 Figure 2: Worldwide carbon pricing initiatives. Source: World Bank – State and Trends of Carbon Pricing 2020
Biofuels produce fewer carbon emissions than conventional fuels, so a carbon price can be calculated based on the greenhouse gas reduction of each RIN, which represents different fuel types. Figure 3 is based on historical RIN pricing that the Energy Information Association (EIA) publishes weekly for each RIN. Note the variability of RIN pricing in recent years. This variability can be explained in part by several factors:
- Renewable volume obligations (RVOs) increased more slowly during the Trump administration
- Small refinery exemptions (SREs)
- Corn ethanol blend wall
- Oversupply of corn ethanol in recent years
- Limited penetration of fatty acid methyl ester (FAME) biodiesel due to cloud point
- Pace of investment in renewable natural gas outpaced D3 RIN obligations after 2017
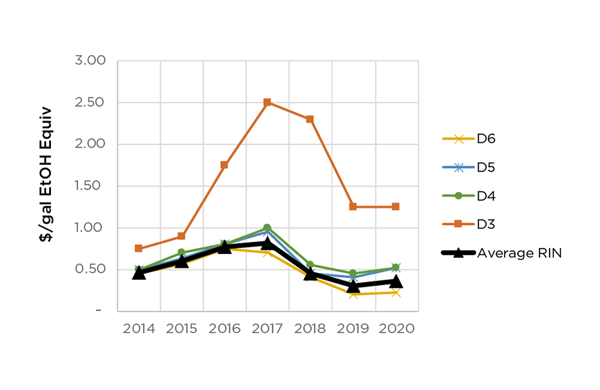 Figure 3: RINs pricing (per gallon of ethanol equivalent). Source: Energy Information Administration
For the oil refiner, the cost of RINs in recent years has varied from approximately $1.50 to $3/bbl, which is now large enough to push some refineries out of business or convert to biofuels. While these numbers appear small, it is not unusual for refineries to drift in and out of “break-even” territory, which is often in the $5 to $9/bbl range depending on the location.
When portrayed as a carbon price, it becomes more apparent why RINs have a significant impact on the market and emissions. Figure 4 shows the weighted average RIN price in recent years has been higher than the California Low Carbon Fuel Standard (LCFS) incentive (currently, near its $200/ton cap in 2016 dollars). Further, it is at par with some of the highest taxes in the world, such as Sweden’s carbon tax of $130/ton.
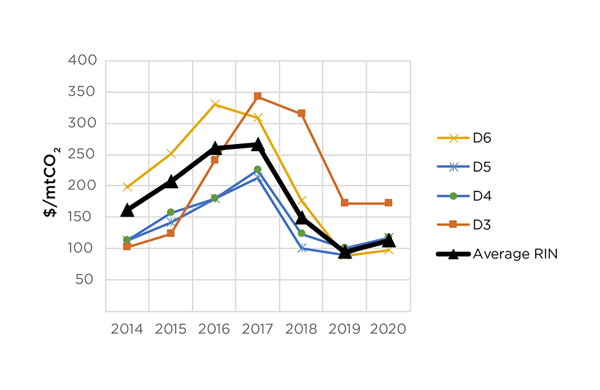 Figure 4: RINS pricing illustrated as a carbon price. Source: Energy Information Administration
As illustrated by the recent boom in renewable diesel facility announcements, the biofuels investment environment in the United States is quite friendly, with stacked incentives for RINs and LCFS of over $300/ton, not including the Blender’s Tax Credit, which expires in 2022. The current pandemic — along with the size of these incentives — spurred a flurry of announcements.
Moving forward, the biofuels investment environment is fluid, with incentives possibly changing in regions such as Canada and the Northeast United States. At 1898 & Co., our clients are interested in both current and future markets that are the most lucrative for their renewable business ventures. We do the research necessary to understand the transparent incentives while also uncovering the hidden incentives that build up a business case for a new project.
Learn more about proper planning and investment while developing, constructing and commissioning a new renewable diesel plant.